
Goals:
Introduction to “geographical information systems” (GIS) and some of the basics techniques. The focus will be mainly on how one can digitize an image of a map—the process of georeferencing—and extract useful geographical information from it.
Software:
- QGIS, a Free and Open Source Geographic Information System (install it from https://qgis.org/en/site/)
Class:
- Basics of QGIS
- Basics of Georeferencing
Projection Issues
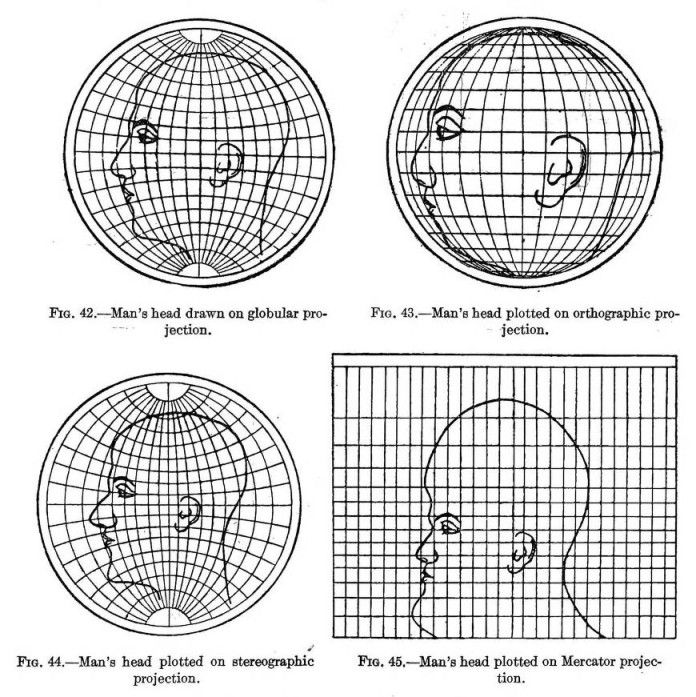
See, https://en.wikipedia.org/wiki/List_of_map_projections.
A Digital Map: Layers of Goodness
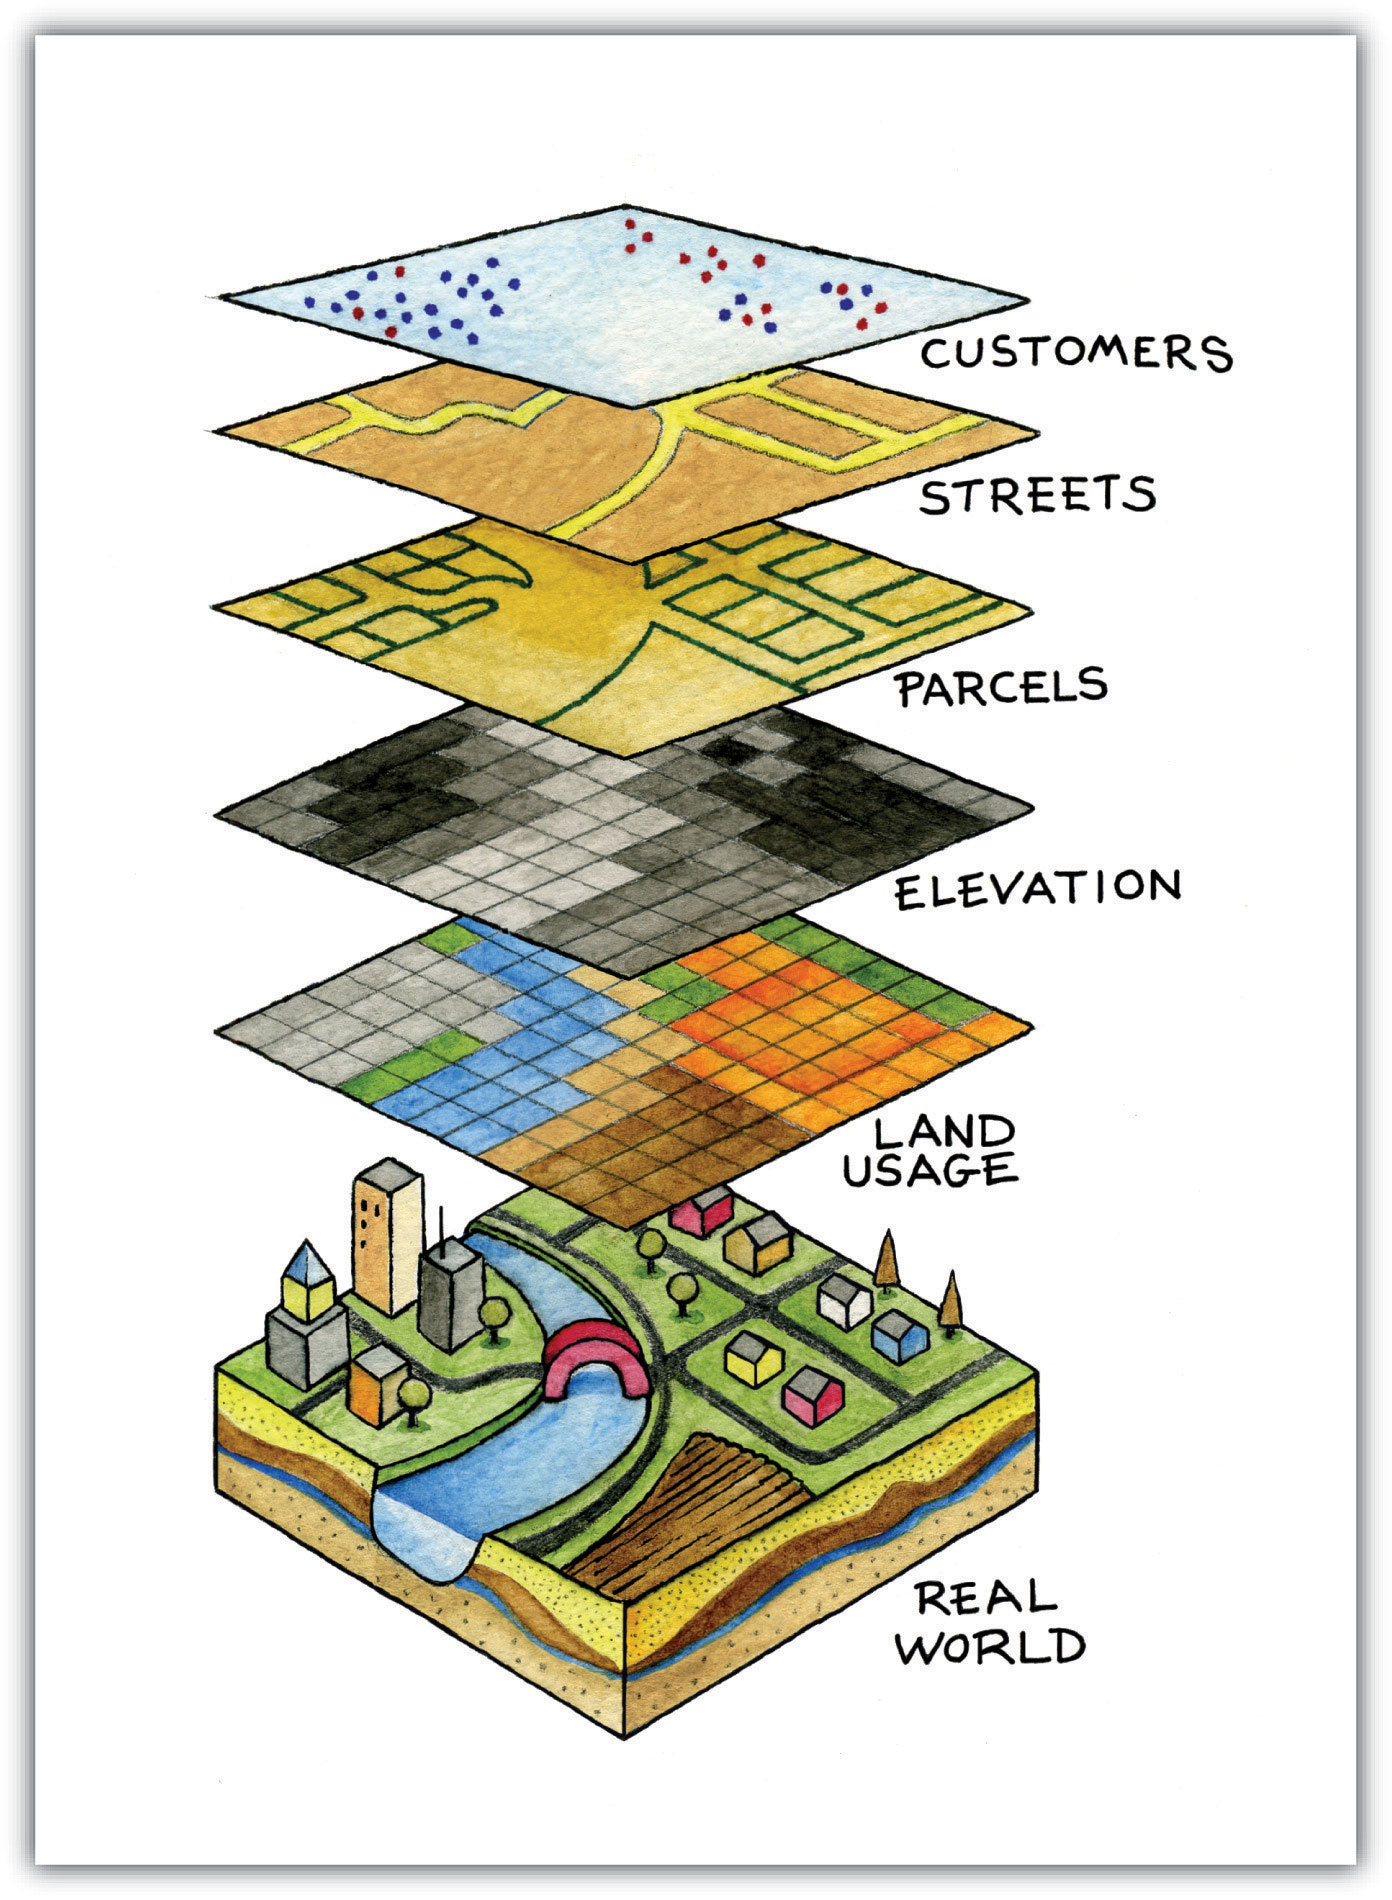
- Layers:
- Analytical Layer
- Our Data
- Annotation/Legend
- Social Geography
- Political Boundaries
- Settlements, etc.
- Physical Geography
- Types of surface
- Continents / Coastal Line
- Elevation profile
- Rivers, Lakes, etc.
- Base Layer: Graticule
Main Types of Data: Points, Lines, Polygons
- Analytical Layer
- Our Data
- Points:
- item, x[1], point(lat, lon)[2]
- Lines:
- item, x[1], from(lat, lon)[2], to(lat, lon)[2]
- Polygons:
- item, x, area(lat, lon; lat, lon; … lat, lon)[2]
- Points:
- Annotation/Legend
- Our Data
[1] where x is a categorical parameter; [2] lat/lon: decimal coordinates (not DMS)
Georeferencing
QGIS must be installed and running. Note: Interfaces might differ from system to system; the same applies to different versions of QGIS. Before we proceed, you may want to add Google Layers. To Add Google maps layer: (on the left pane, Browser) XYZ > New connection > paste one of the following links (Source: https://geogeek.xyz/how-to-add-google-maps-layers-in-qgis-3.html):
- Google Maps: https://mt1.google.com/vt/lyrs=r&x={x}&y={y}&z={z}
- Google Satellite: http://www.google.cn/maps/vt?lyrs=s@189&gl=cn&x={x}&y={y}&z={z}
- Google Satellite Hybrid: https://mt1.google.com/vt/lyrs=y&x={x}&y={y}&z={z}
- Google Terrain: https://mt1.google.com/vt/lyrs=t&x={x}&y={y}&z={z}
- Google Roads: https://mt1.google.com/vt/lyrs=h&x={x}&y={y}&z={z}
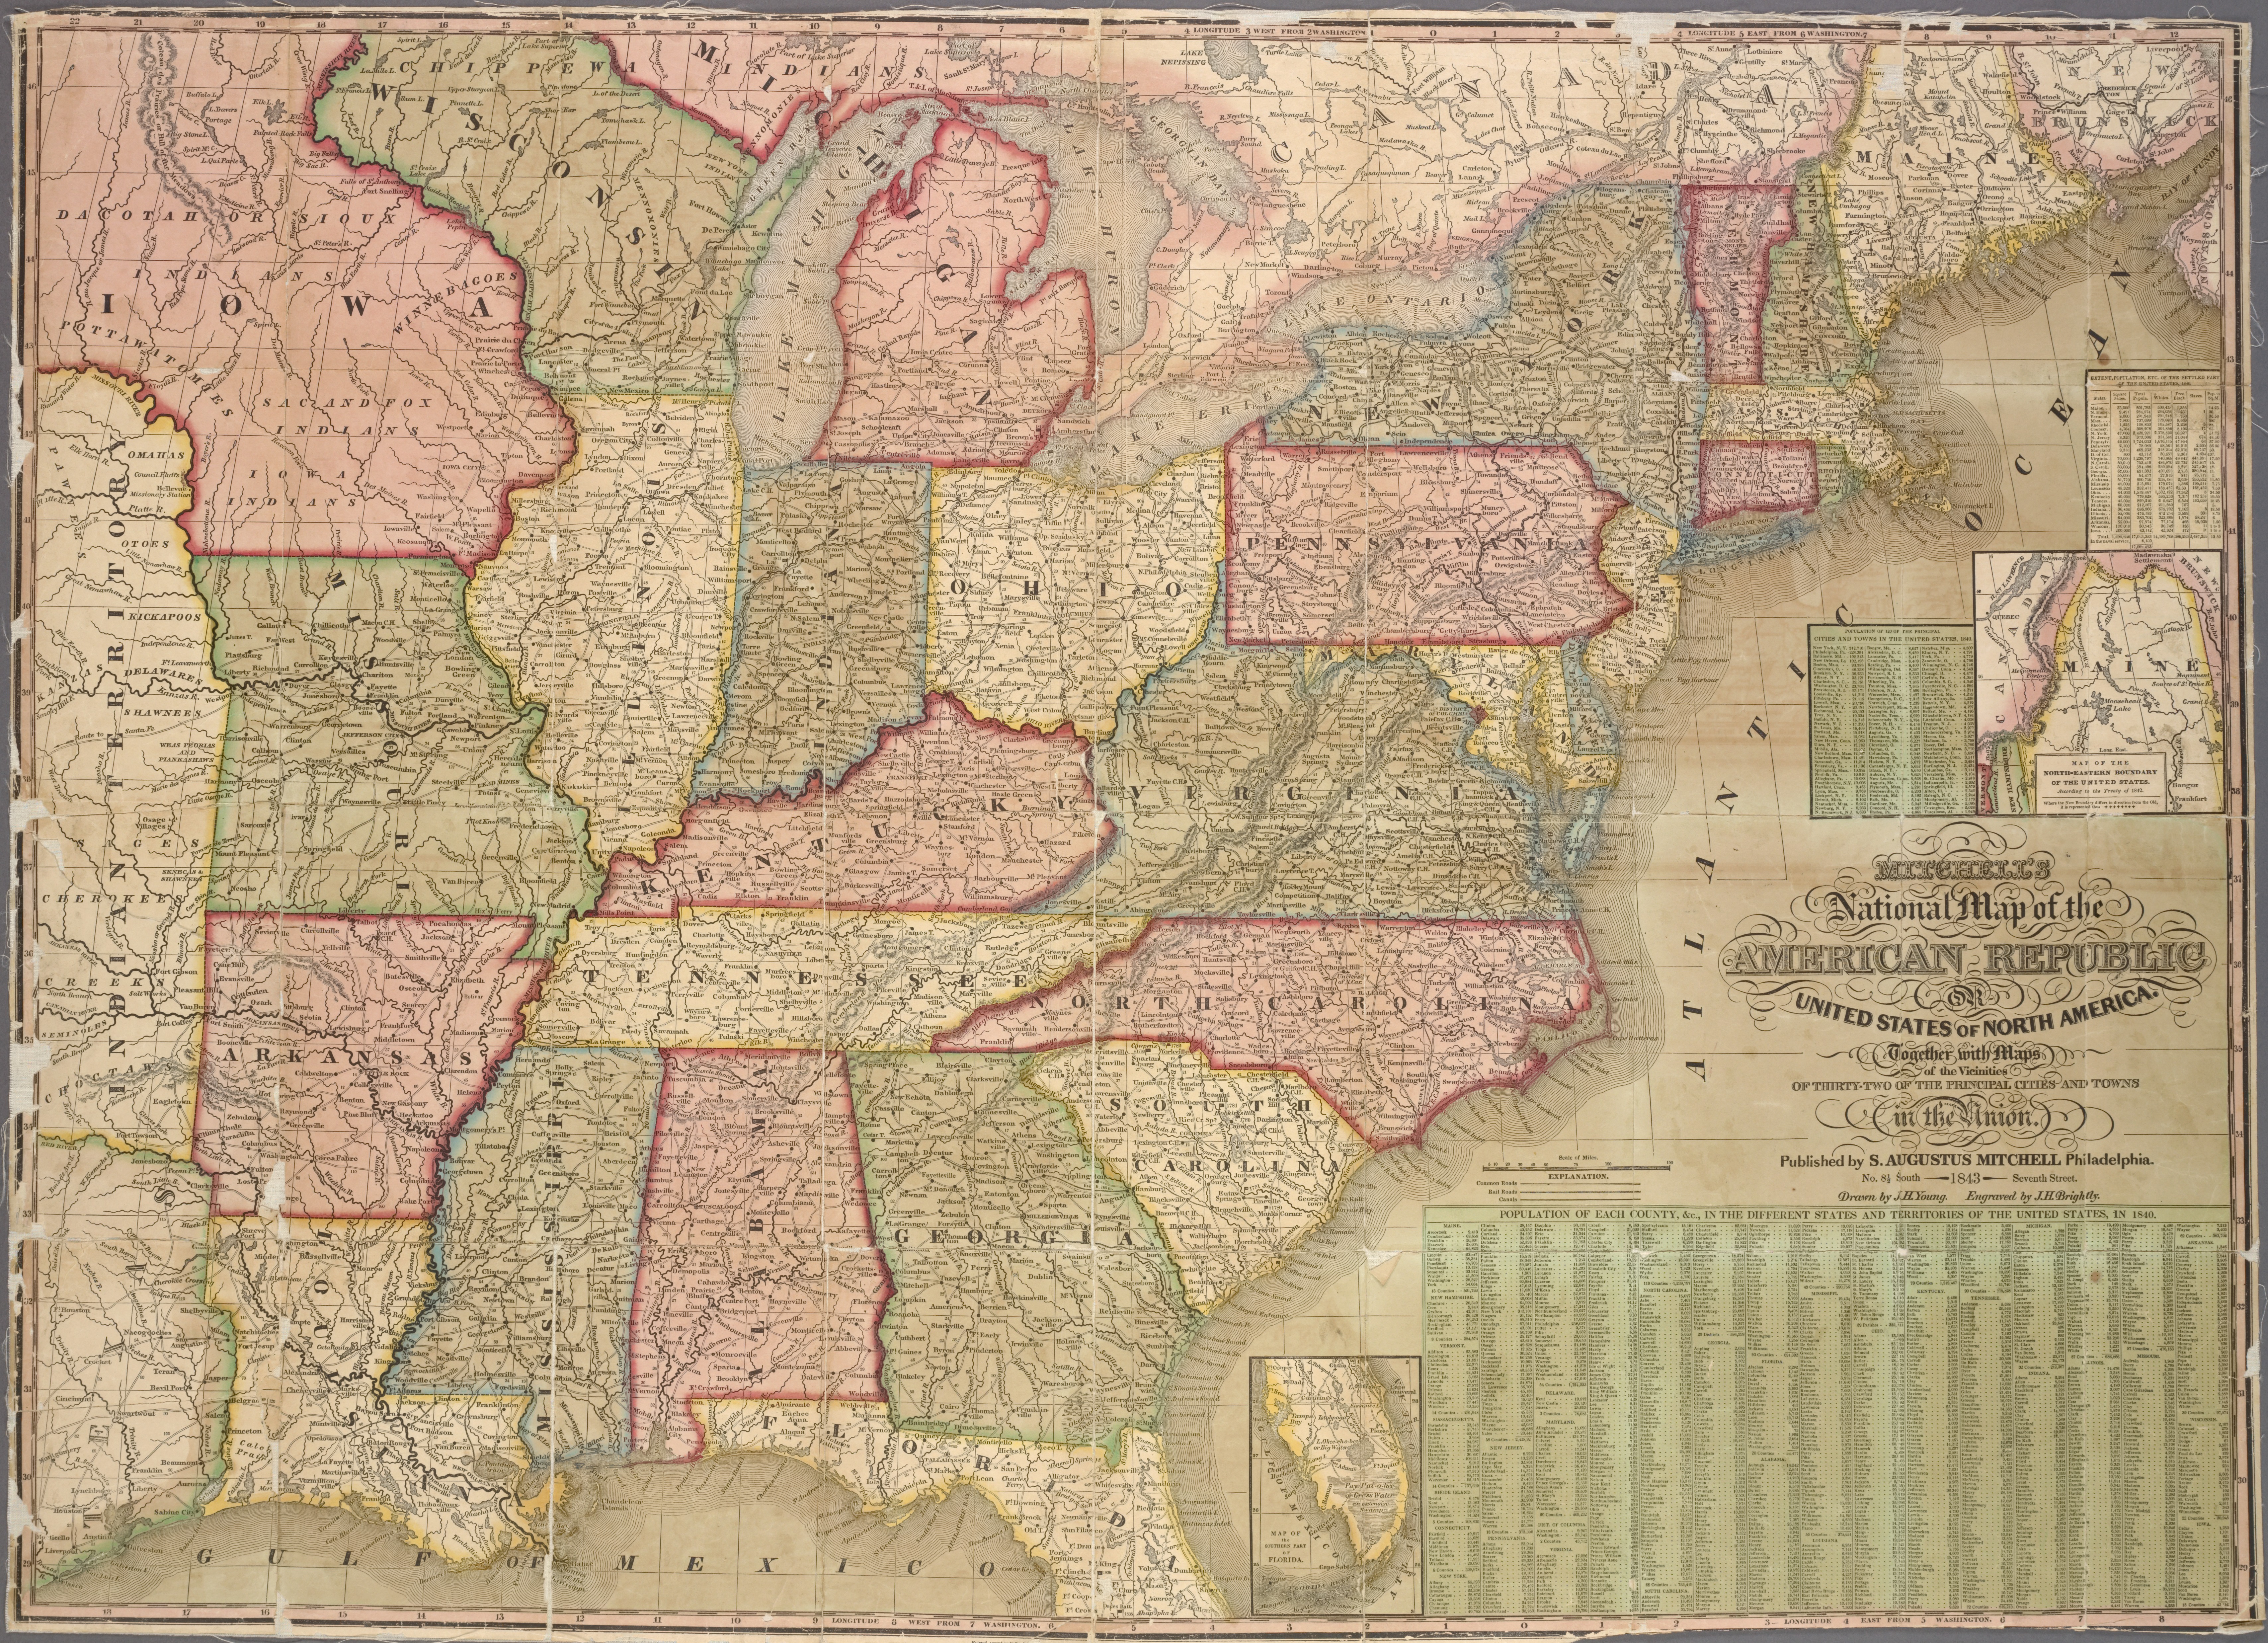
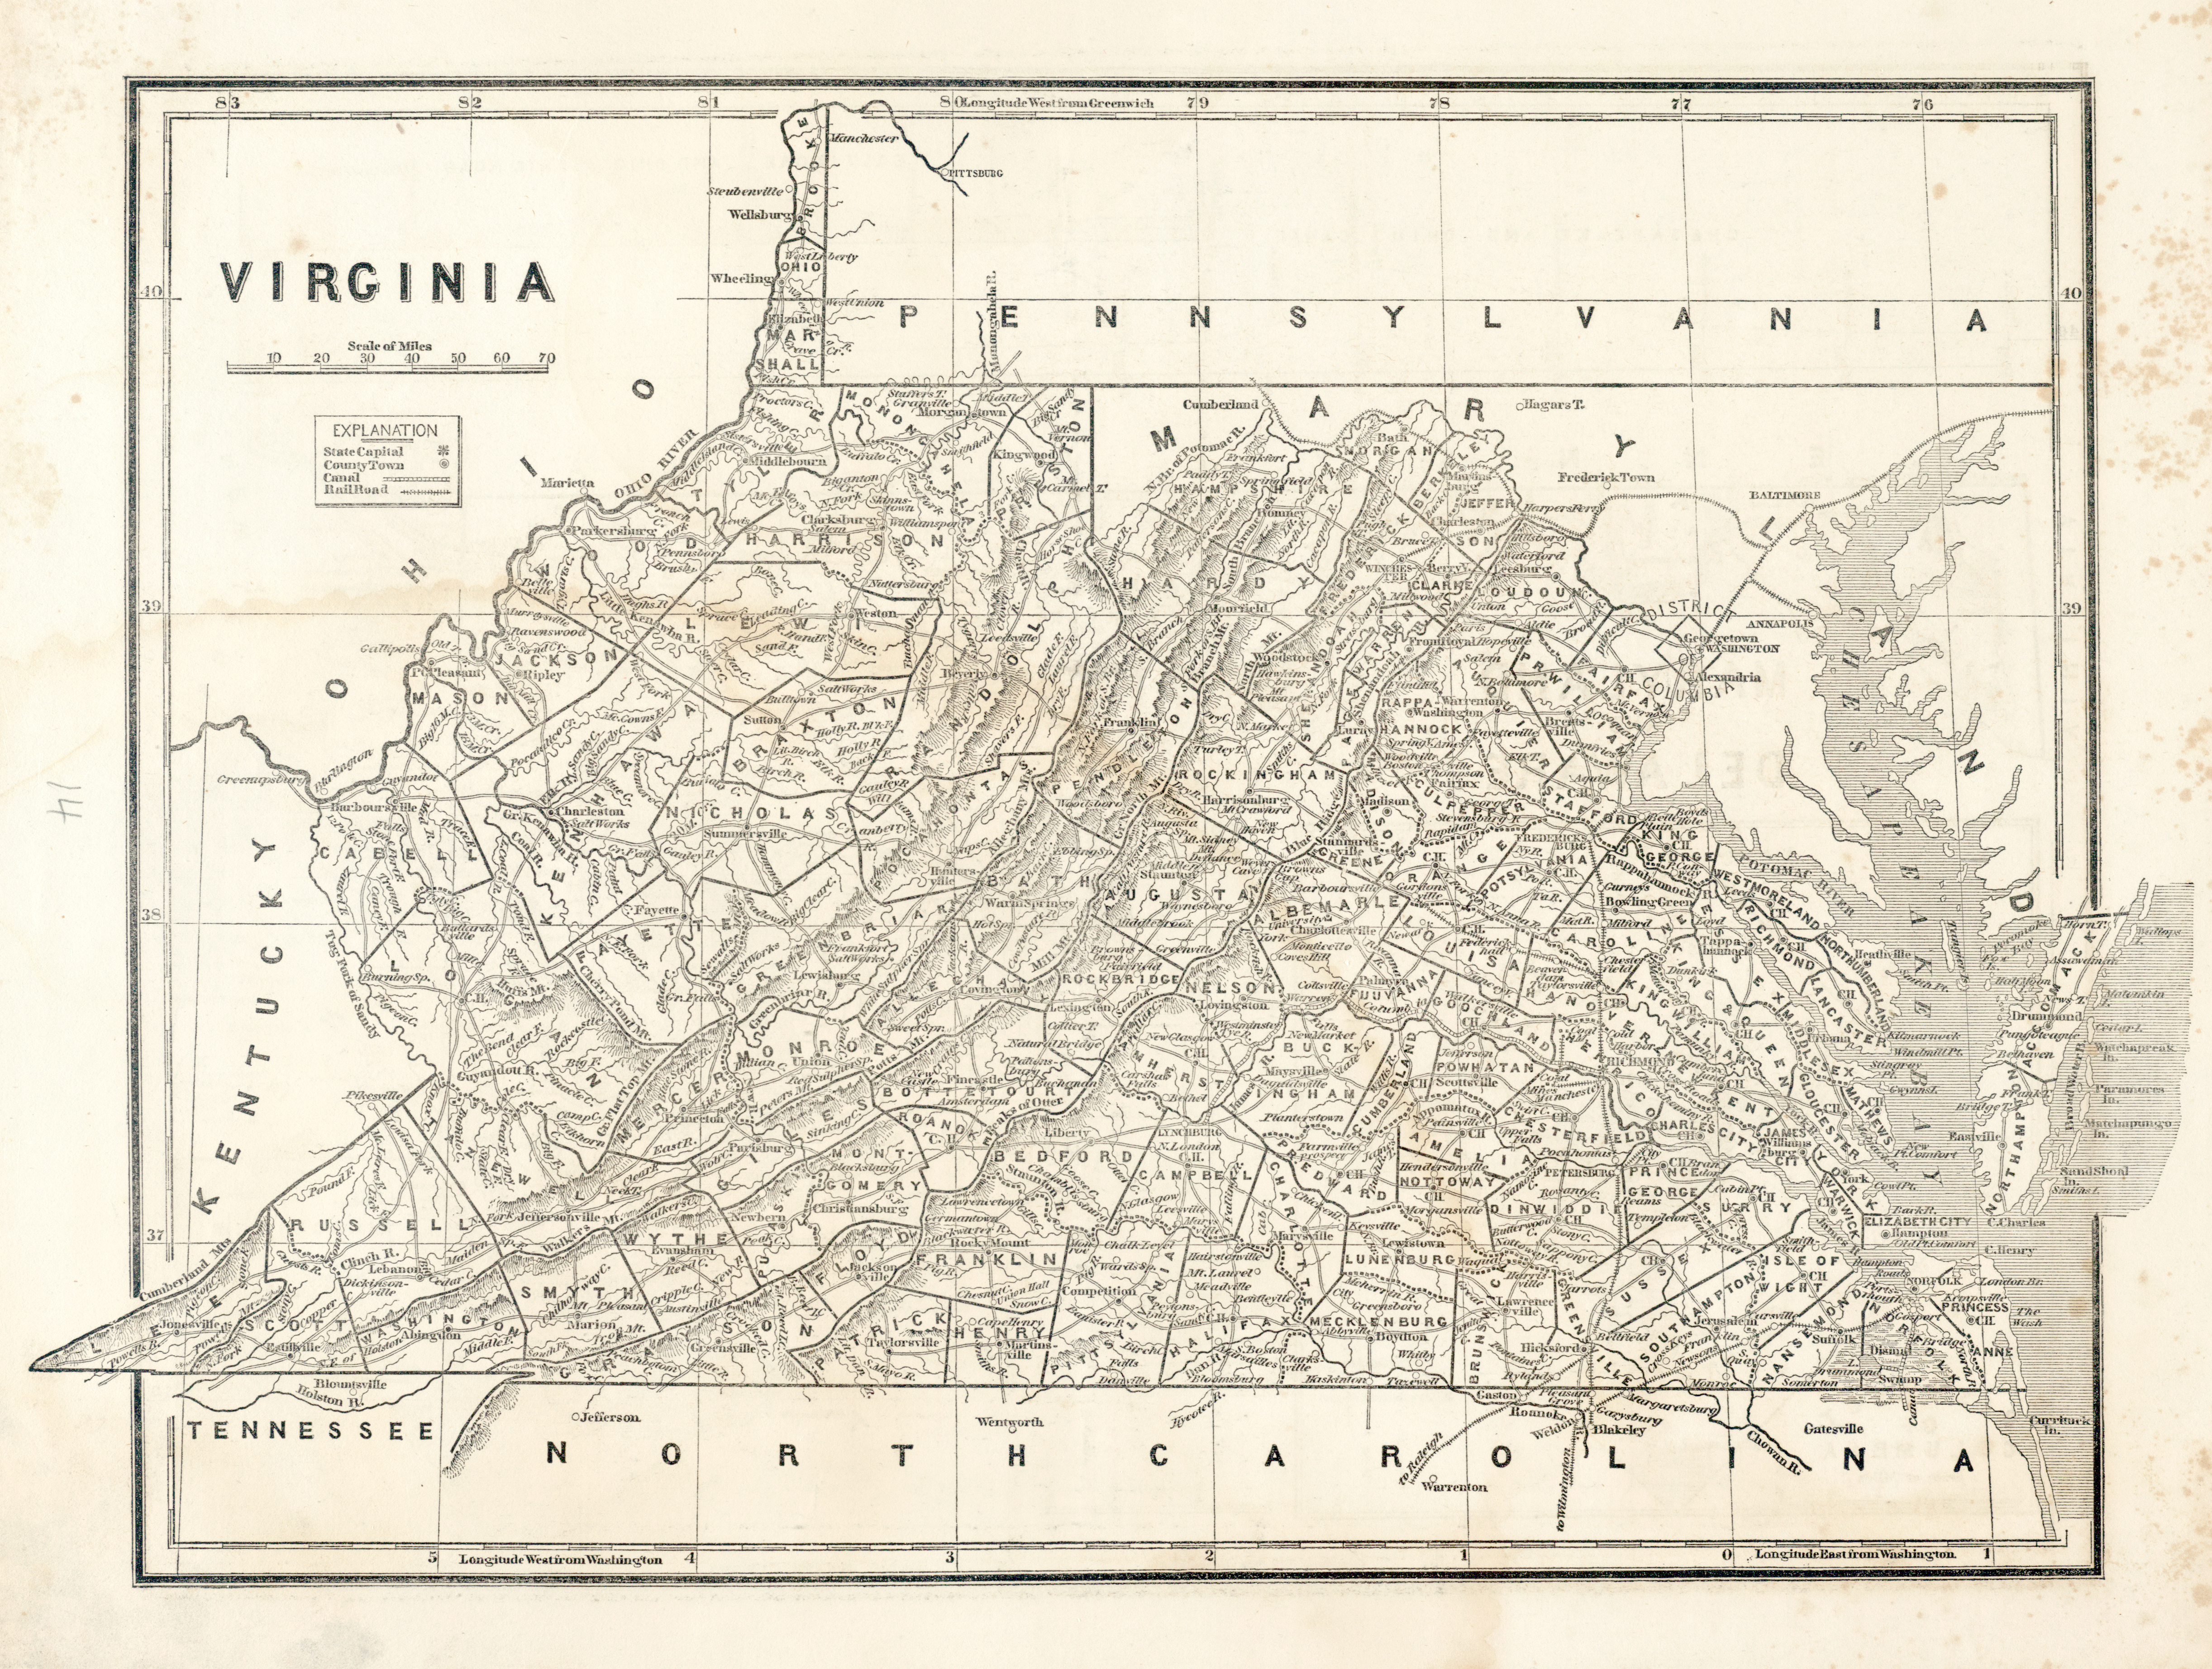
NB: Images of maps to work with below
Step-by-step instructions
- In your
XYZ Tiles, double click on any Google layer that you added (or on OpenStreetMap)- A layer should be added to the main map (see, Layer pane)
- Open Georeferencer:
Raster>Georeferencer- if you do not see it there, it must be activated first:
Plugins>Manage and Install Plugins...> [search for georeferencer], then tick a box against Georeferencer GDAL
- if you do not see it there, it must be activated first:
- In Georeferencer:
File>Open Raster(also the first button on the main panel)- Choose a file. Lets start with US_eastStates_03.jpg (this one has a grid, so it will be easier to process)
- In Coordinate Reference System Selector, choose WGS 84 / Pseudo-Mercator, then clock
OK
- Open
Settings>Transformation settings(or click the yellow gears button)- Choose settings like on the screenshot below (you can also change
Compressionsetting, which will generate a smaller map-image):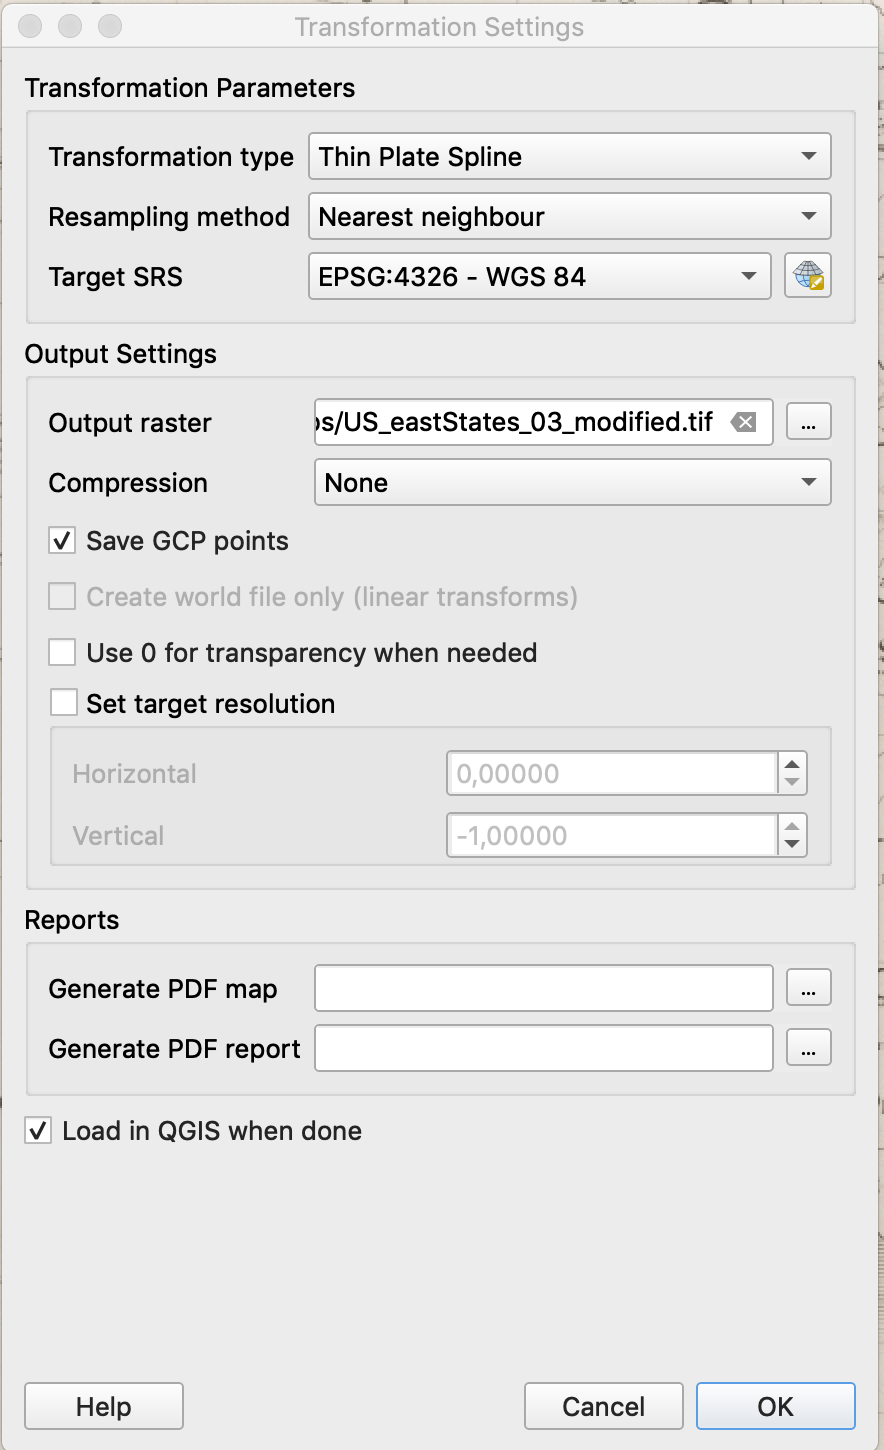
- Choose settings like on the screenshot below (you can also change
- Now, adding georeference points:
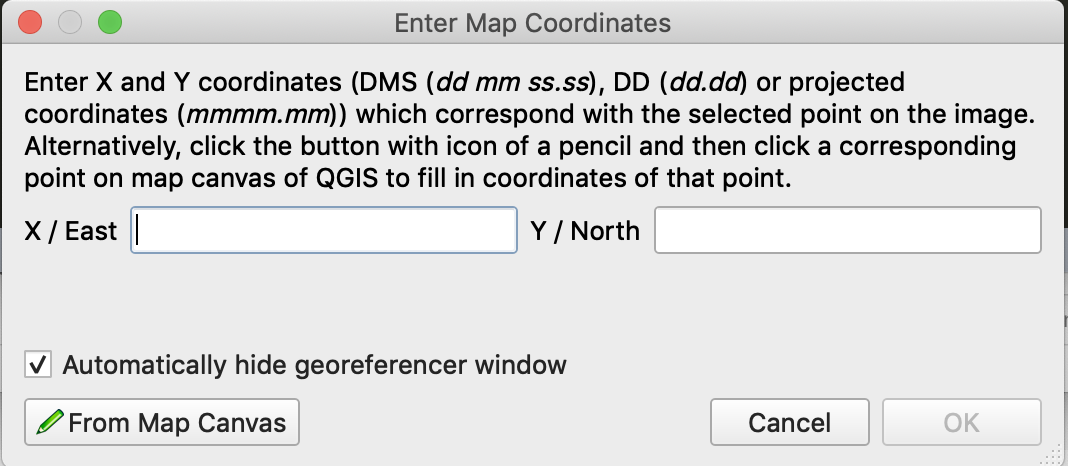
- If you have a grid, it is very easy: just type in coordinates
- If you don’t, it is tricky: you need to find the same features on the image and on the map (for this, click on
From Map Canvas)
- [!!!] Ideally, if you know projection of the map, you only need a few points; this almost never happens, so, the more points you create, the more precisely your image will be georeferenced. This is easy when you have a grid.
- When you are done with collecting points, click on
PLAYbutton (green triangle)- The image of your georeferenced map should appear in the main window.
- [!!!] Keep in mind that you add layers to your map and a layer on top may cover the layer below!
In general, this procedure can be extremely helpful if:
- you need to collect geographical information from historical maps
- you want to use some historical map as the base layer for mapping your data
Collecting Point Data (Very Simple Way)
- Create a CSV file; copy/paste the content from below (three lines of text!)
city,state,lon,lat,lon1,lat1
New York,New York,-8234229.297,4970380.761,-8234229.297,4970380.761
Philadelphia,Pennsylvania,-8368867.370,4858182.367,-8368867.370,4858182.367
- In QGIS, load this file by:
Layer>Add Layer>Add Delimited Text Layer- Settings should look like on the screenshor below
- CSV (comma separated format)
- Point coodinates (X field:
lon; Y field:lat) - Geometry CRS:
EPSG:4325 - WGS 84 / Pseudo Mercator - (you will have only two lines of data, instead of five)
- Make sure to click
Addwhen you are done!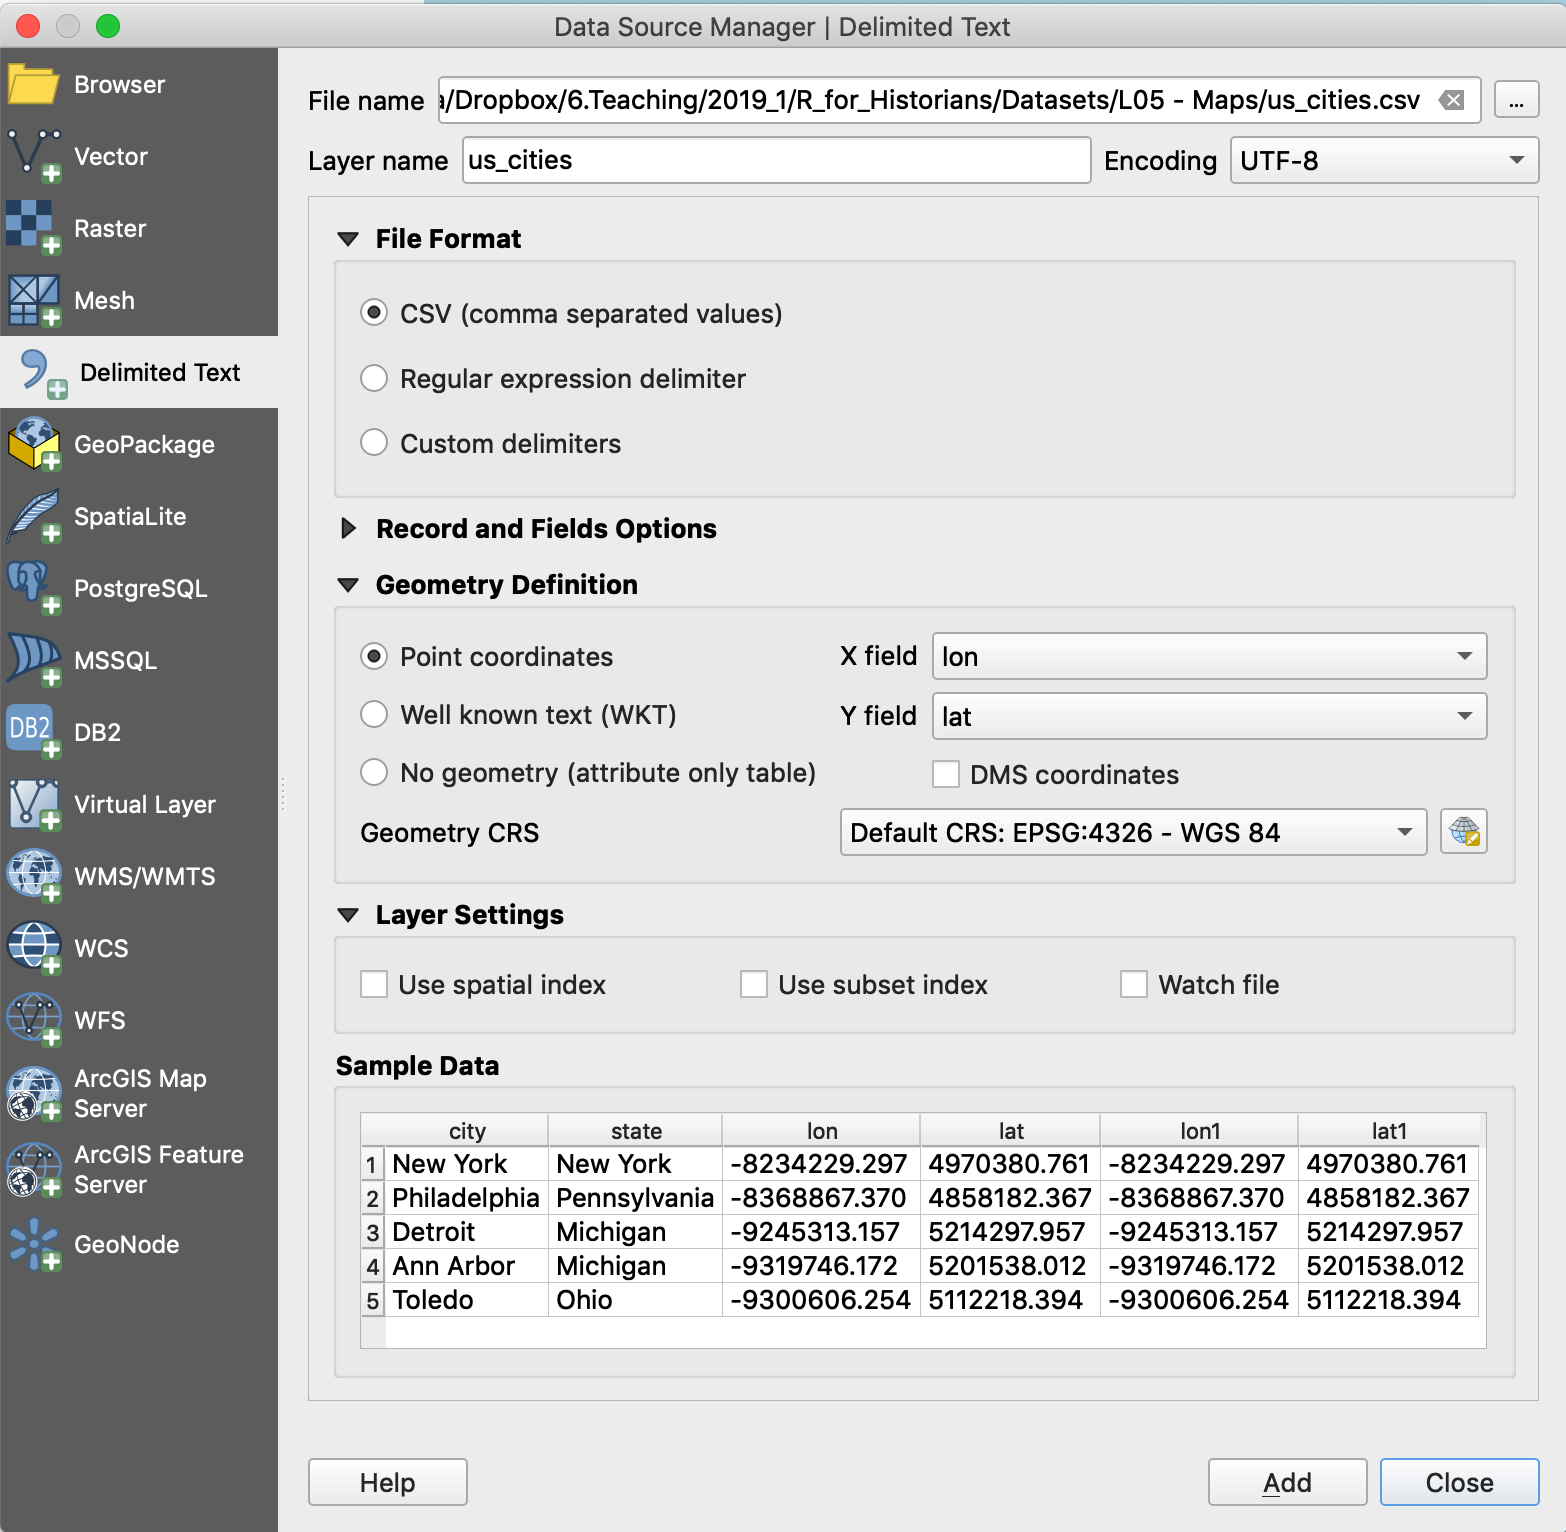
- The layer is there, but we need to add labels to see the cities
- Right-click on the layer > Properties
- On the tab
Labelschange the settings like on the screenshot below - Click
Apply, thenOK.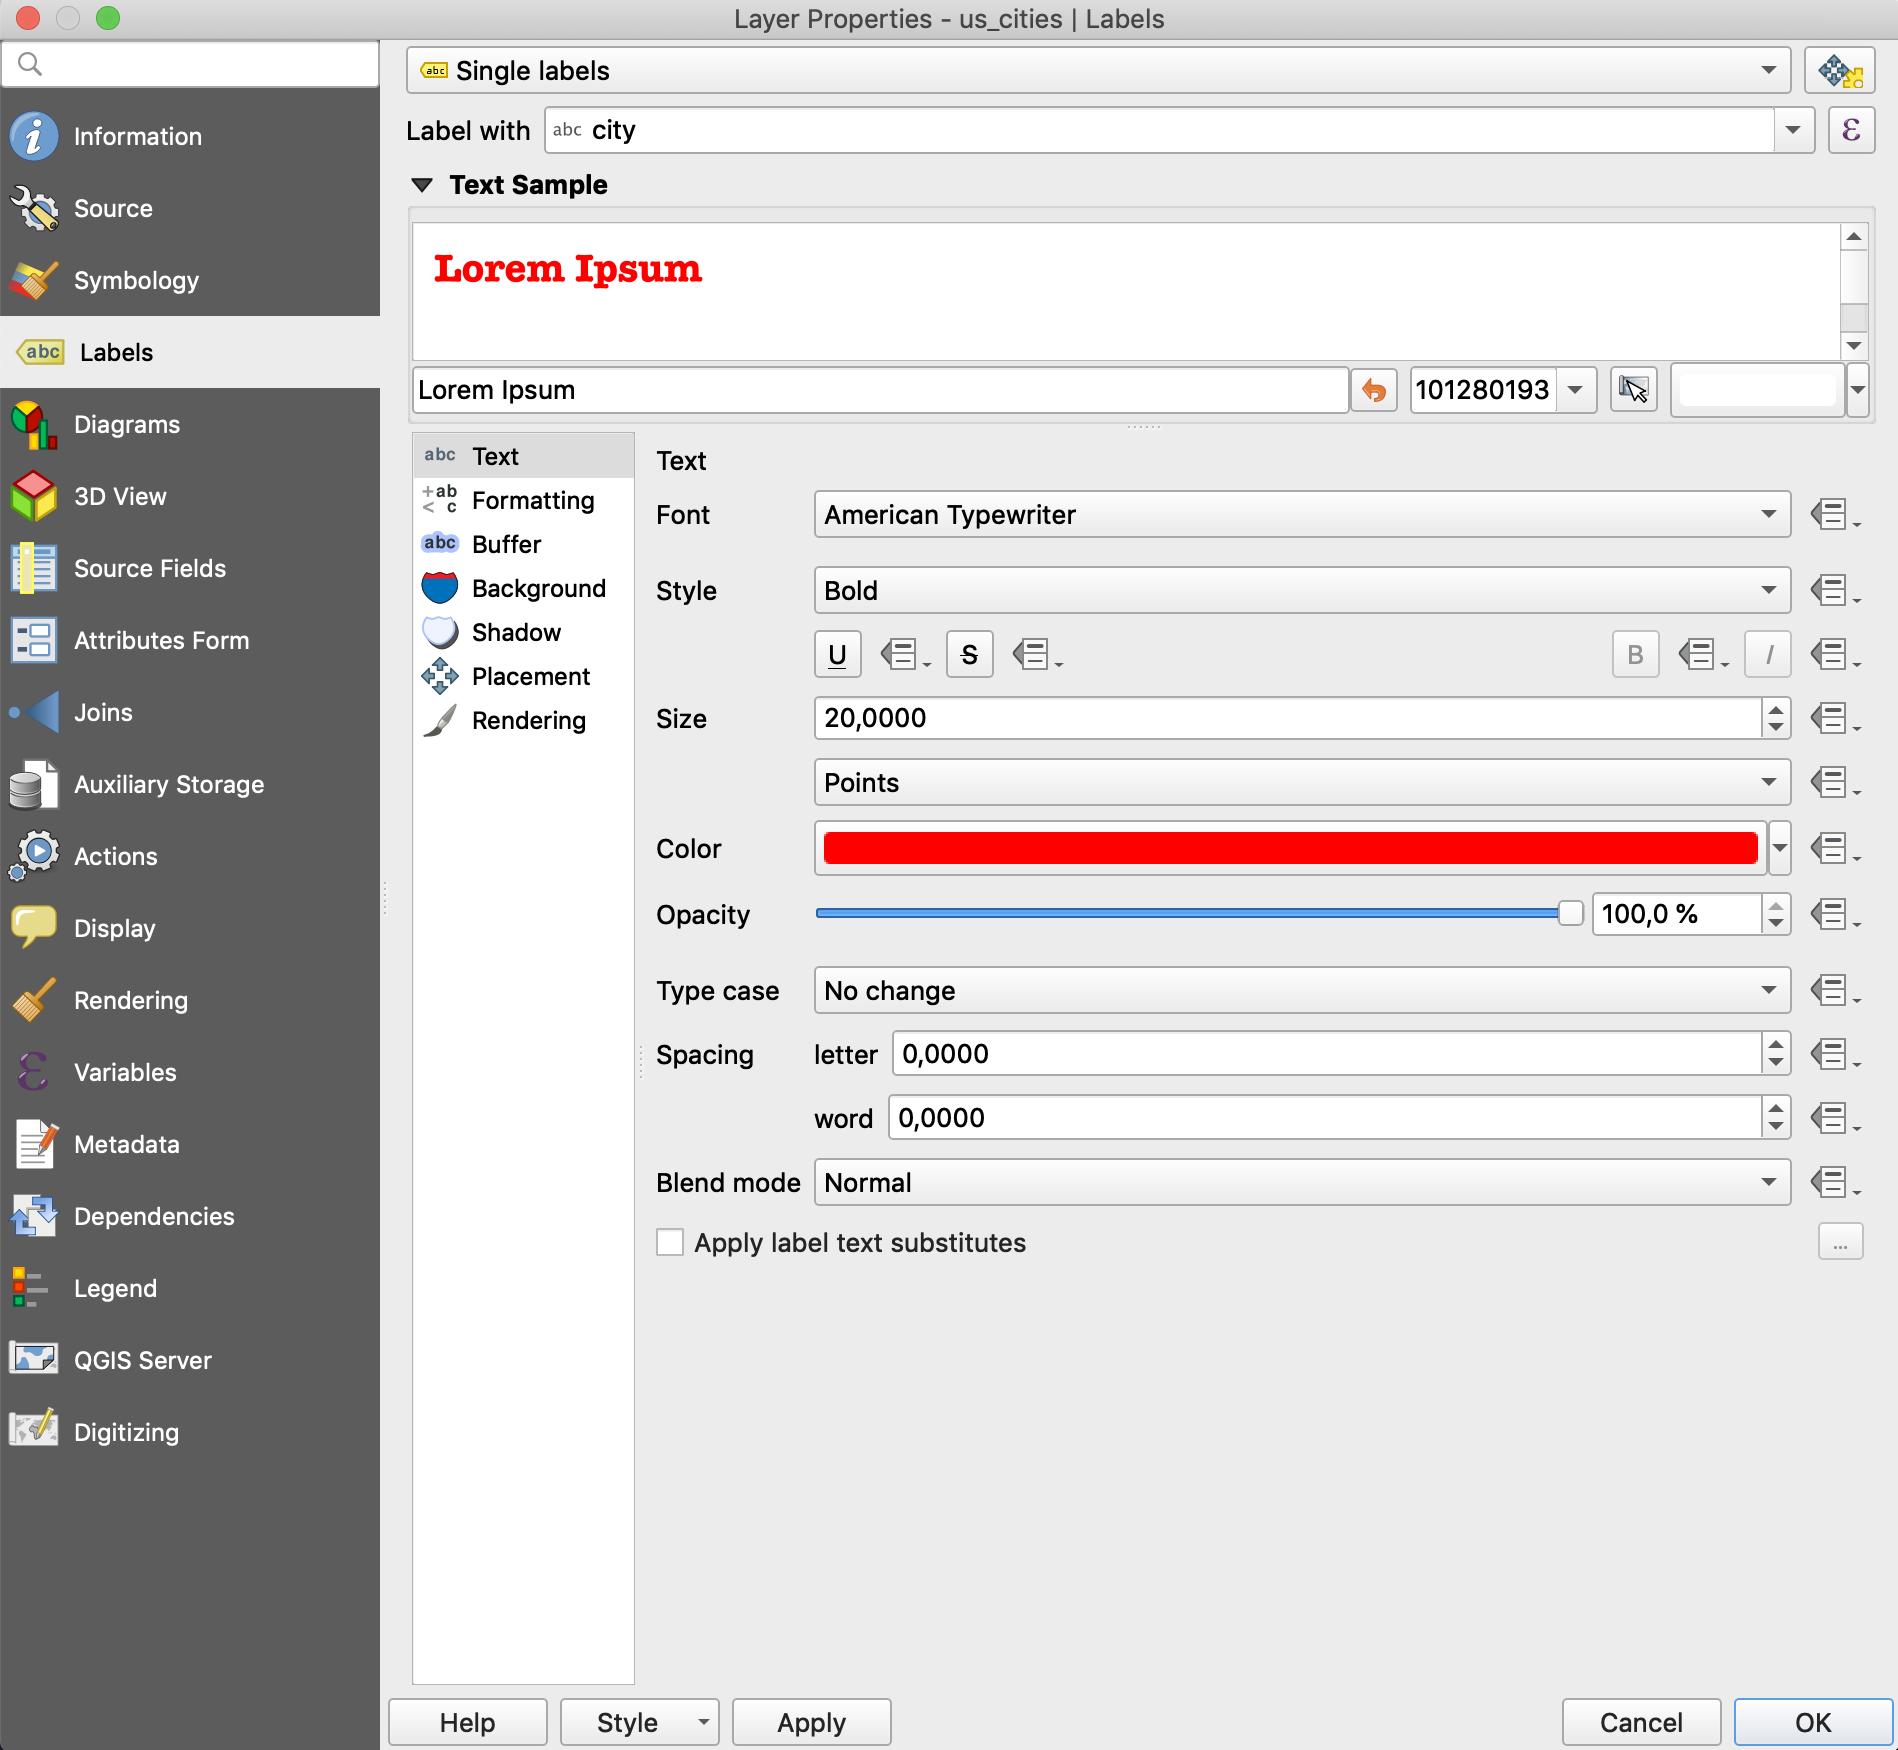
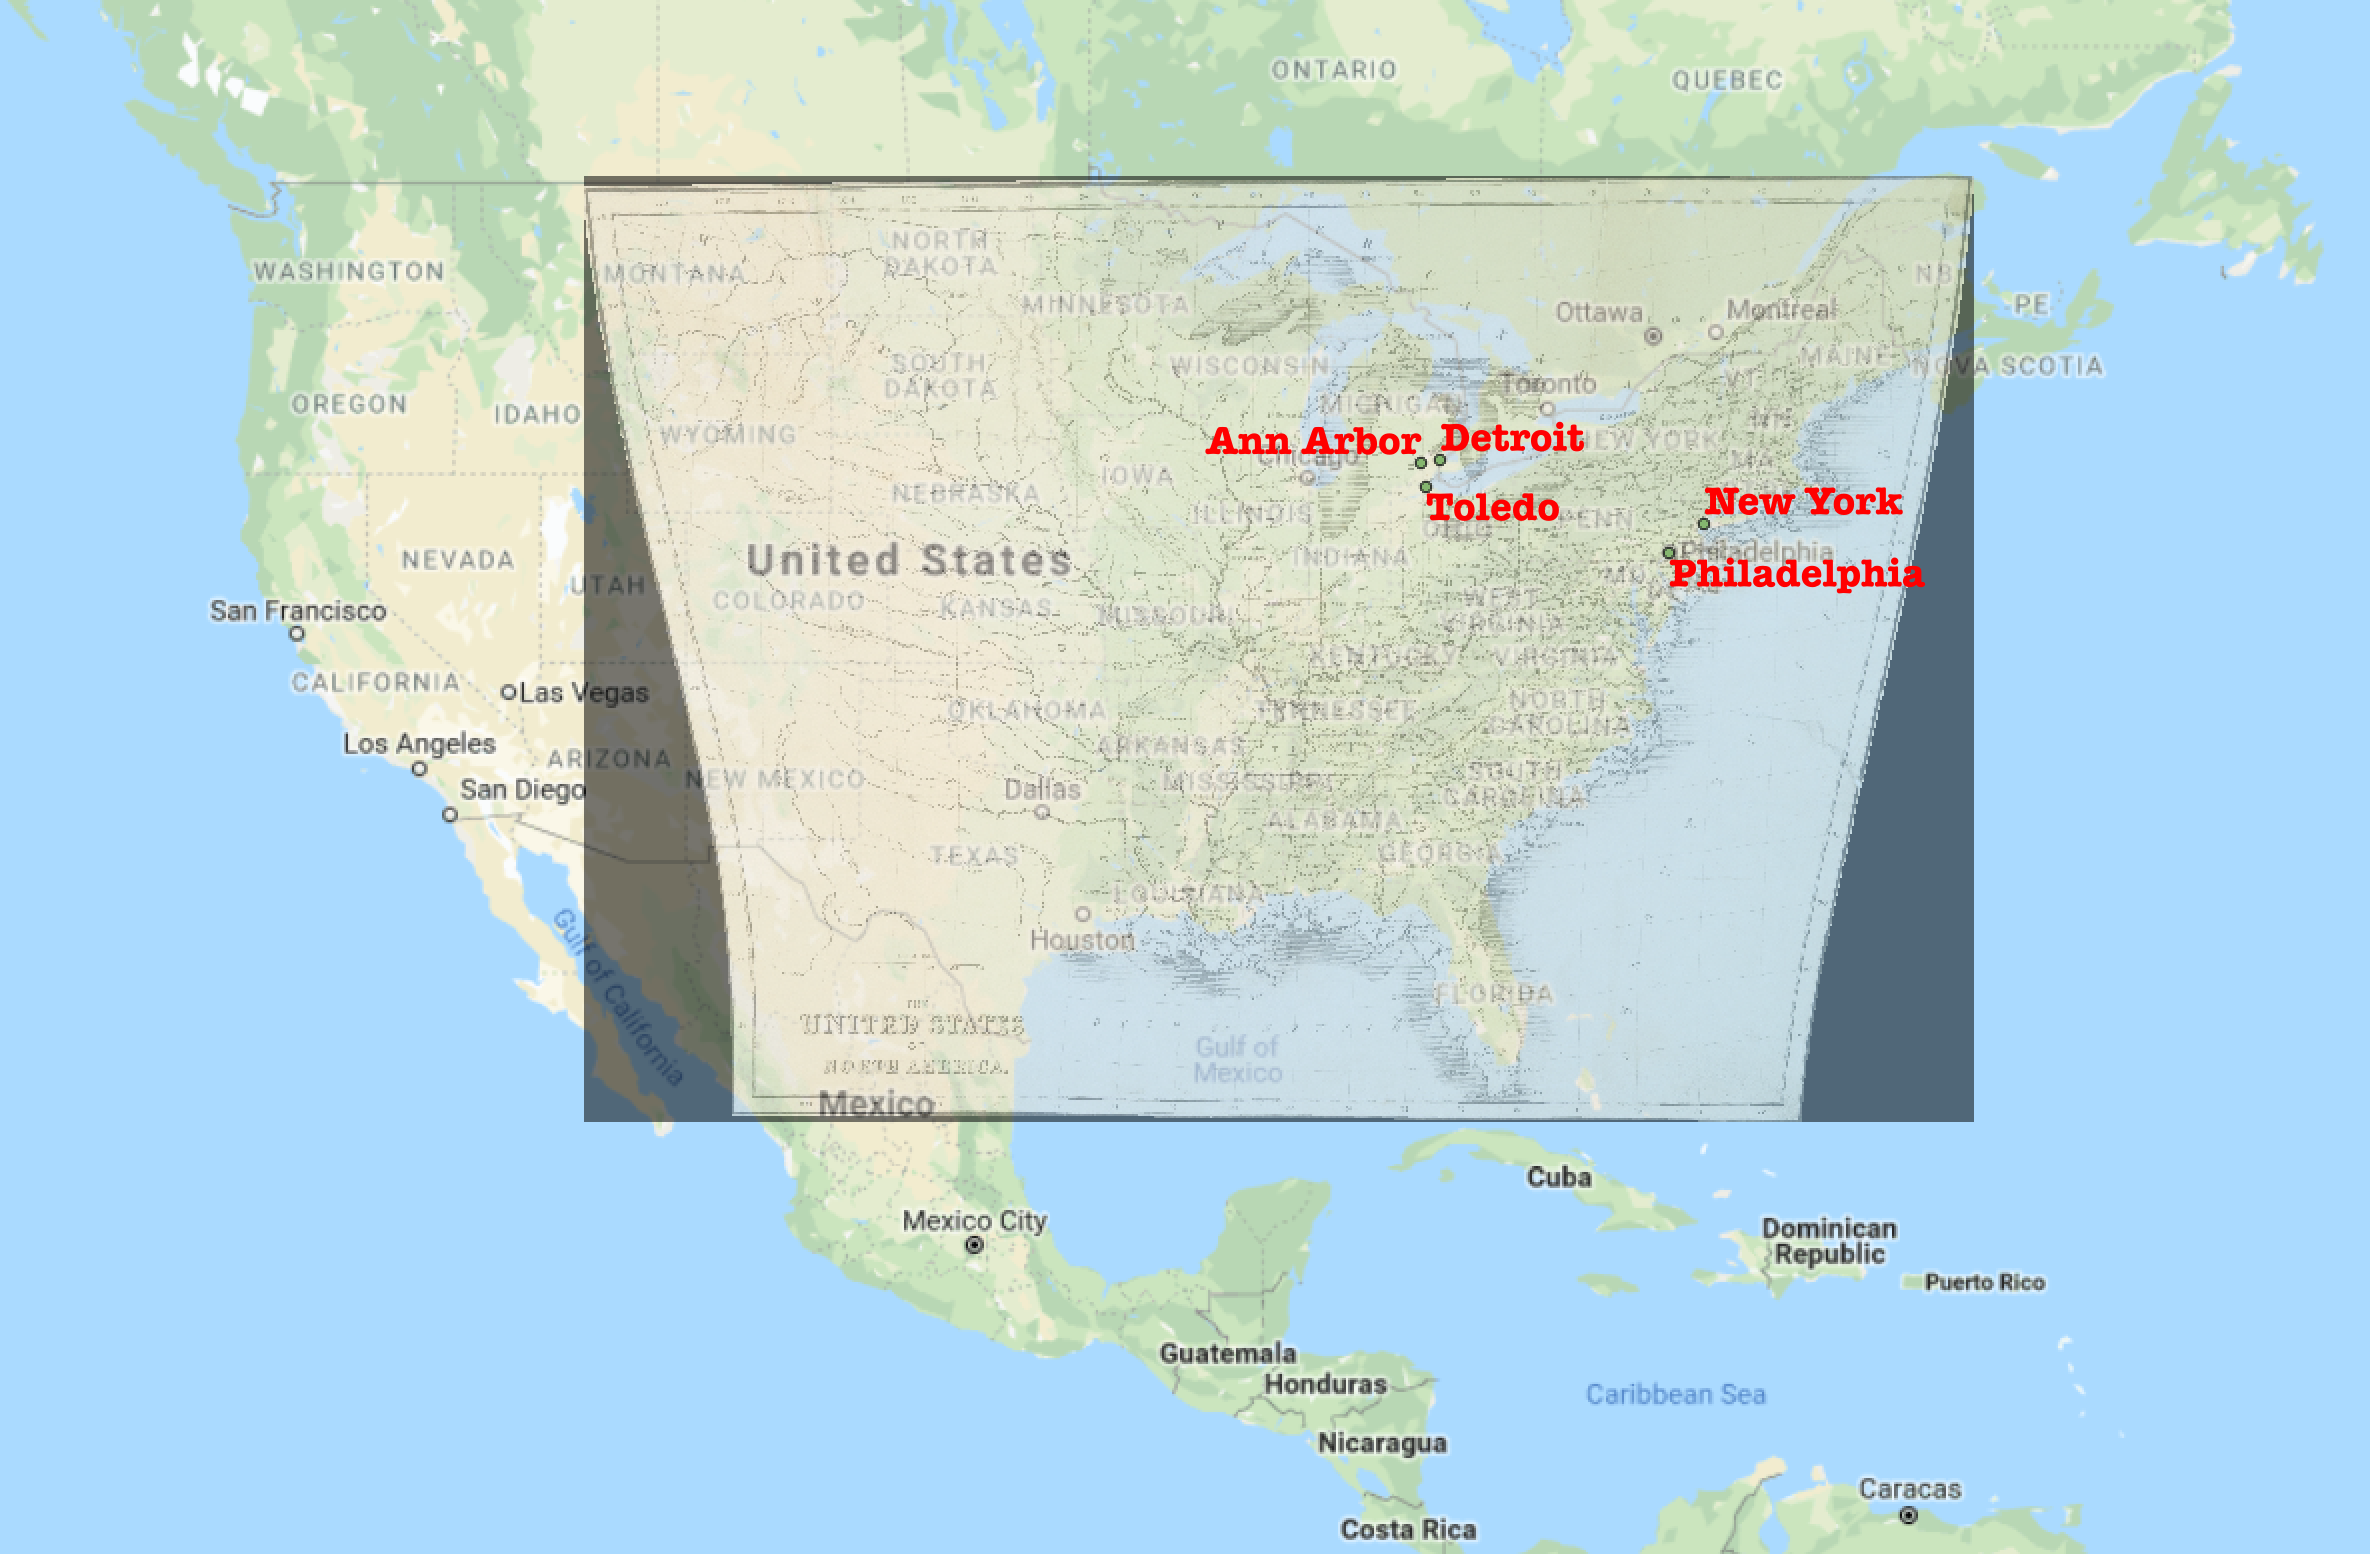
- You should see two cities now on the map:
- If nothing appears, try: Right-click on the layer > Set CRS > Set Layer CRS: Choose
WGS 84 / Pseudo-Mercator
- If nothing appears, try: Right-click on the layer > Set CRS > Set Layer CRS: Choose
- Now, we can use
Coordinate Captureplugin to collect data from our georeferenced map:- If activated, coordinarte capture should be visible in lower right corner
- To activate coordinate capture:
Plugins>Manage and Install Plugins...> [search for coordinate capture], then tick a box against Coordinate Capture
- To activate coordinate capture:
- If activated, coordinarte capture should be visible in lower right corner
- Collecting coordinates:
- Keep the initial CSV open in some editor
- In
Coordinate Capture, click Start capture- Click on any point on the map > coordinates of that location will appear in the plugin
- Click
Copy to Clipboard
- Go back to the open CSV:
- Add a new line:
- Type the name of the city
- Add comma and type the name of the state (alternatively, just add another comma)
- Now, paste what you copied into Clipboard (this will add two sets of coordinates)
- Save the file
- Add a new line:
- Back in QGIS:
- Switch the layer off and on: after that the newly-added city must appear on the map.
- Repeat, until all required data is collected.
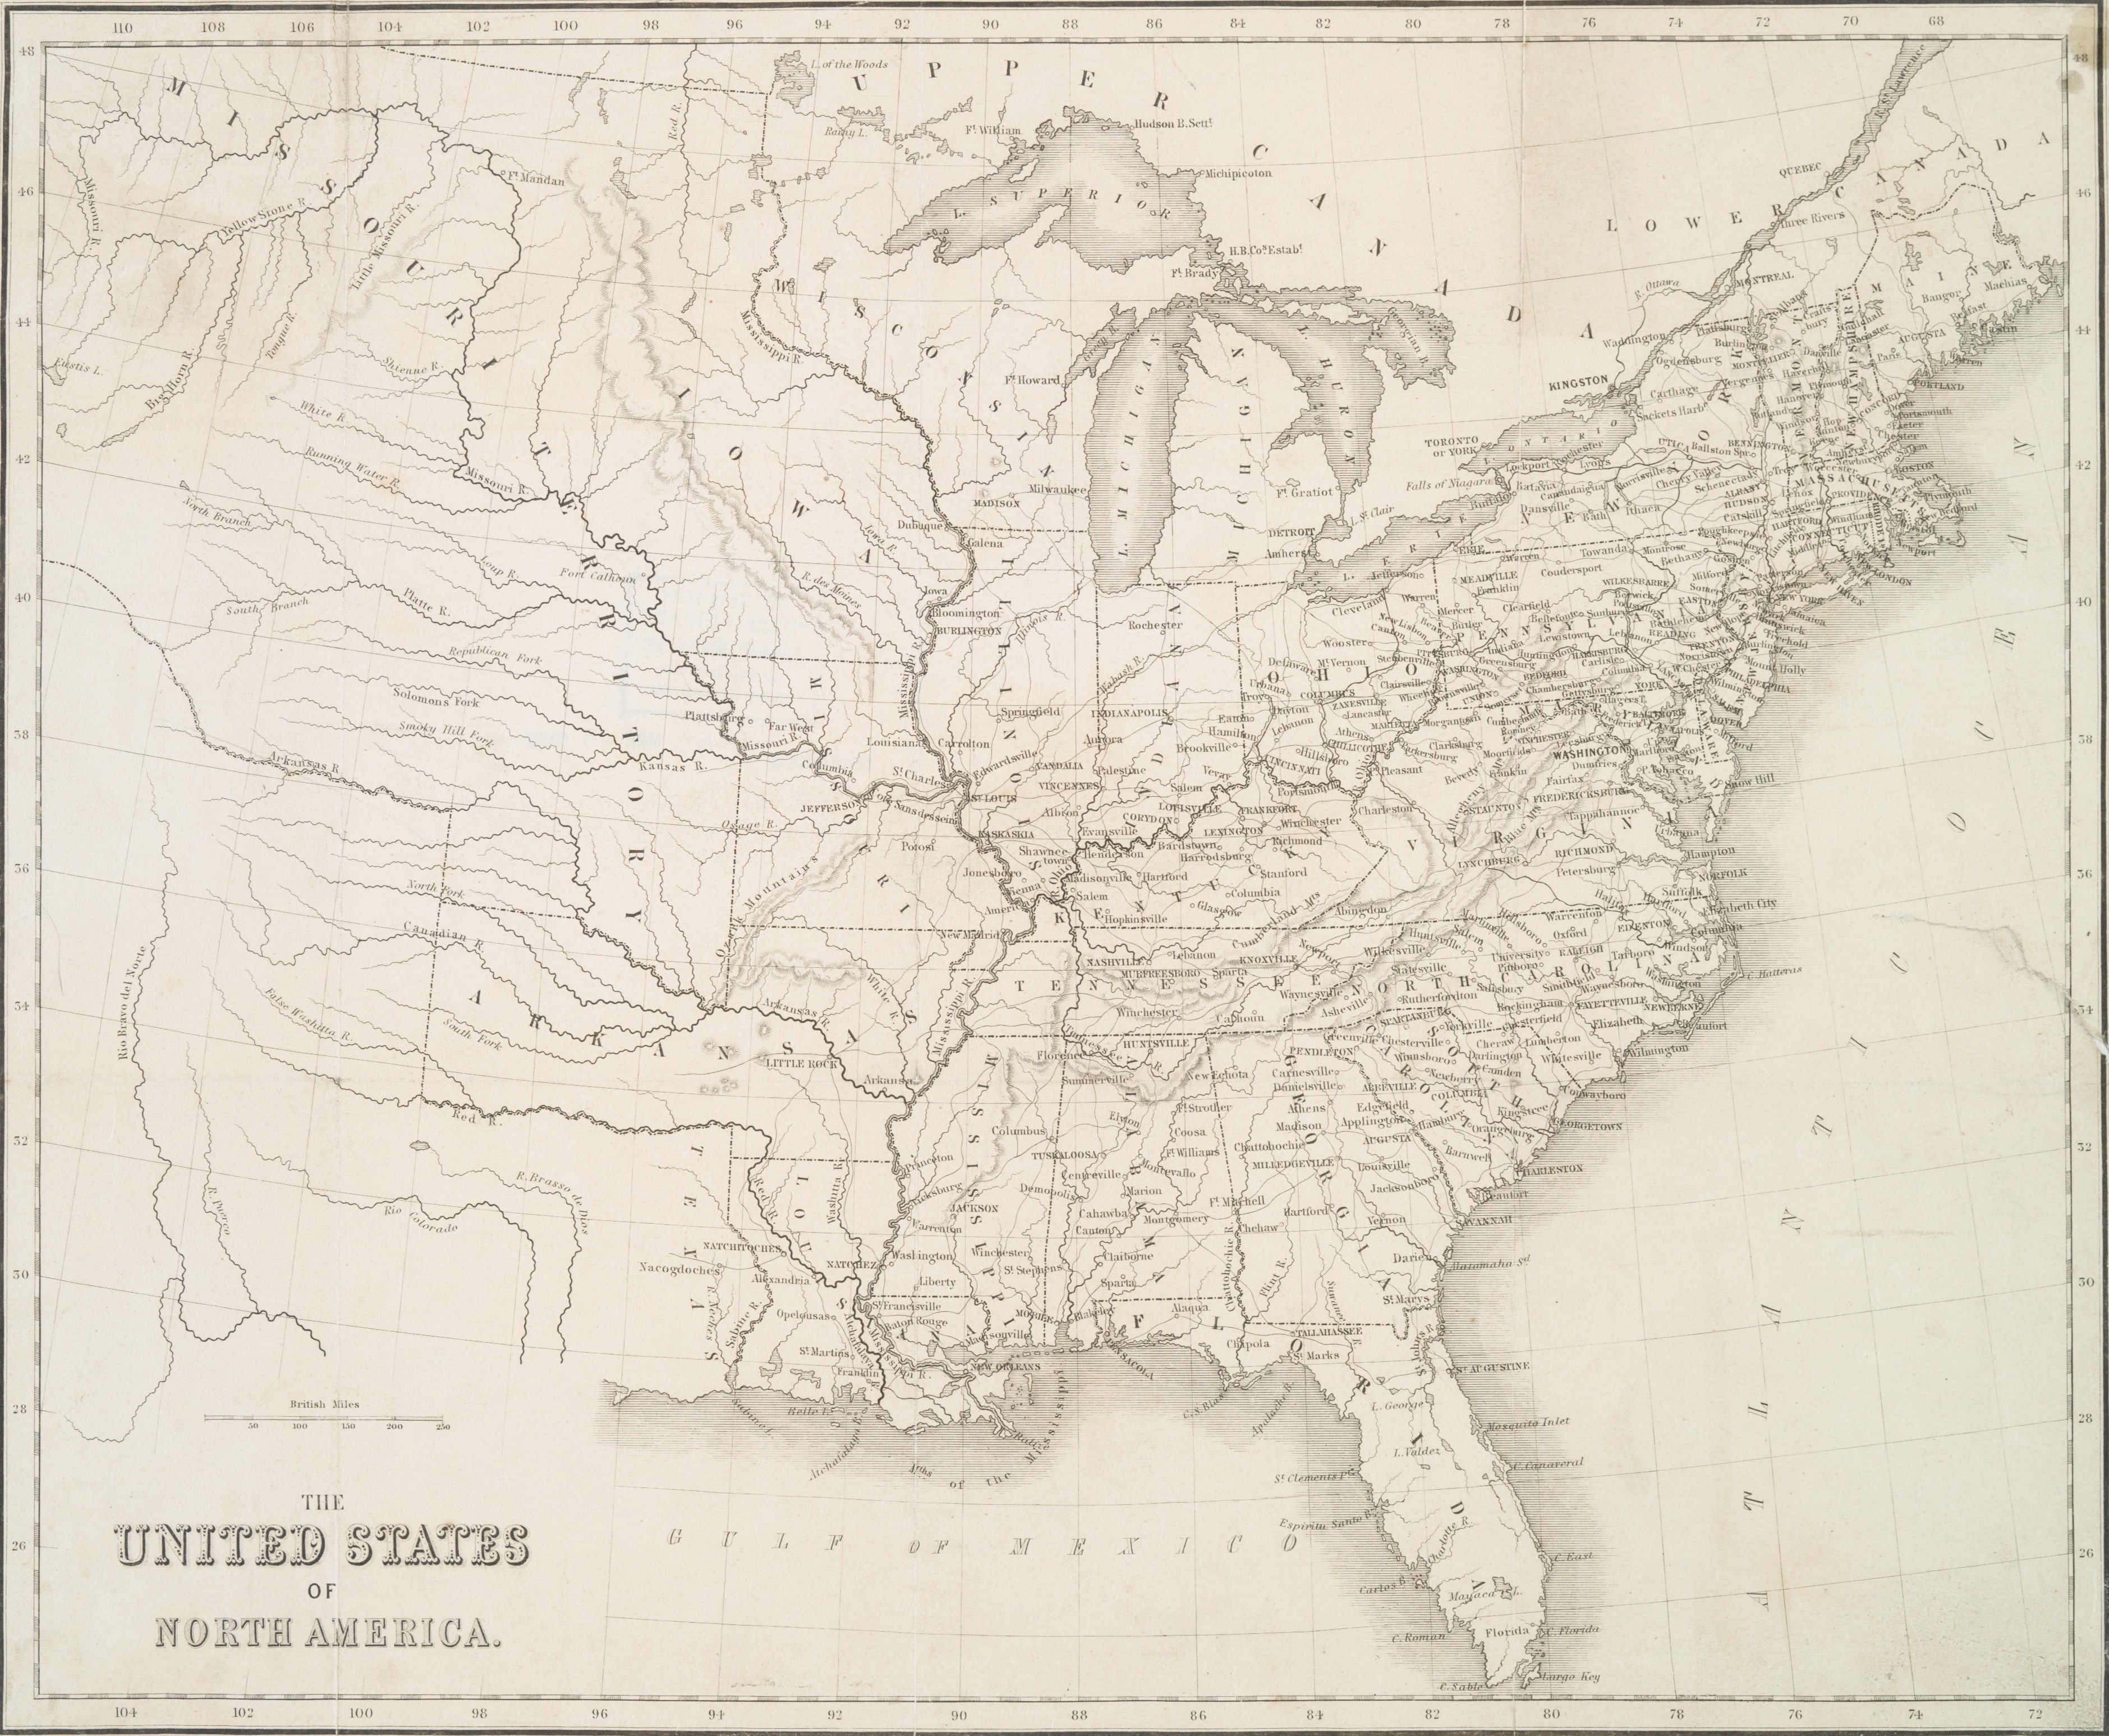
Images of Maps
Reference Materials:
-
Clifford, Jim, Josh MacFadyen, and Daniel Macfarlane. 2013. “Installing QGIS 2.0 and Adding Layers.” Programming Historian, December. https://programminghistorian.org/lessons/qgis-layers.
-
Clifford, Jim, Josh MacFadyen, and Daniel Macfarlane. 2013. “Georeferencing in QGIS 2.0.” Programming Historian, December. https://programminghistorian.org/lessons/georeferencing-qgis.
Homework:
- Georeference two of three offered maps of the US during the Civil War;
- Collect coordinates for 20 place names from each map (into a CSV format: use the same structure as given above).
- Prepare a blogpost on your website with screenshots of both maps and paste the content of your CSV files below each map.
- Codecademy’s Learn Python, Unit 11-12.
- Github: publish the confirmation screenshot as a post on your new site.
Submitting homework:
- Homework assignment must be submitted by the beginning of the next class;
- Email your homework to the instructor.
- if your homework is to create a file, email it as an attachment
- if your homework is a blogpost on your website, email the link to your website and to the blogpost with your homework.
- In the subject of your email, please, add the following:
070112-LXX-HW-YourLastName-YourMatriculationNumber, whereLXXis the lesson for which the homework is submitted,YourLastNameis your last name, andYourMatriculationNumberis your matriculation number.